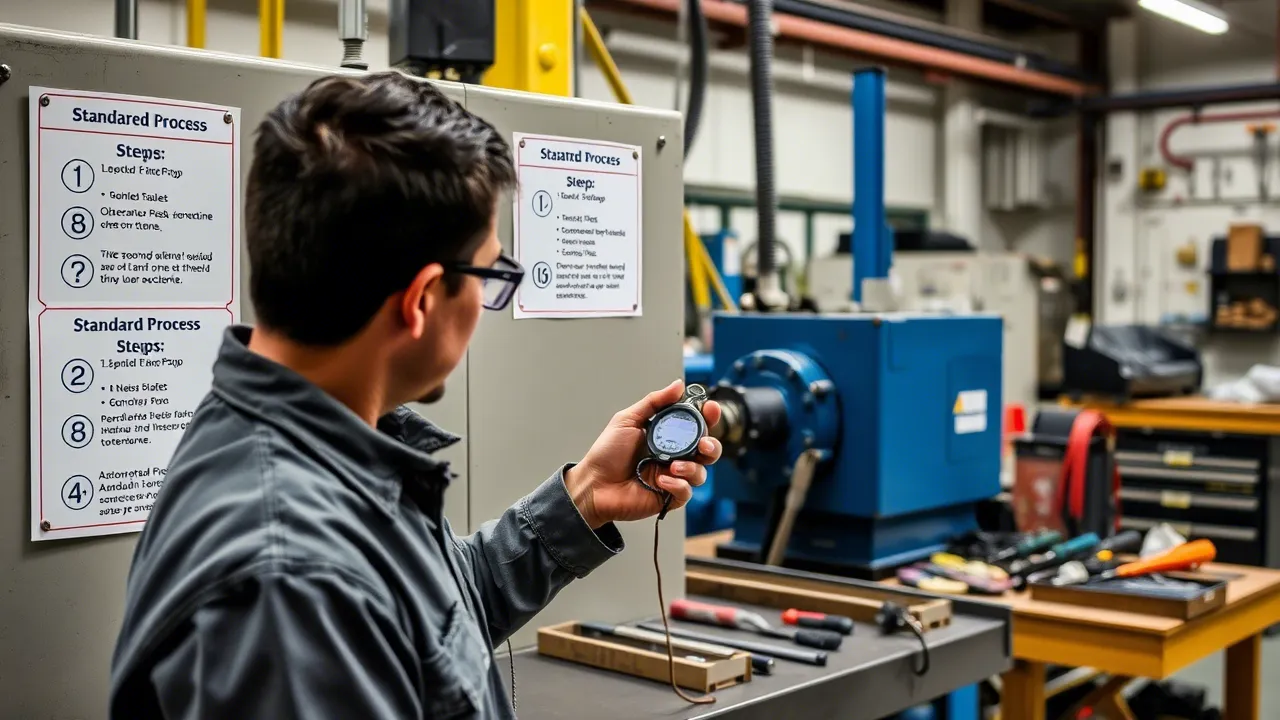
Spain leads the world in vineyard area (930.000 hectares according to the OIV) and produces on the order of 35-40 million hectolitres of wine per year, and it also leads in olive oil (1,29 million tonnes in the 2025/26 season according to AICA data published by the Ministry of Agriculture). Much of this production is received, processed and packaged in agrifood cooperatives, an associative model that is particularly sensitive to the cost of seasonal labour. This article explains how to set up a time study using a digital stopwatch in grape harvest and olive mill operations, two environments where the stopwatch remains the most practical tool because of the irregularity of the flows and the short duration of the campaigns.
The approach combines:
- The classic time study method of direct observation with an on-screen stopwatch (reset to zero, cumulative time or frequency).
- The assignment of a representative activity as a pace factor, which in CronometrasApp is entered manually by the technician —it is not an automatic rating system in the Westinghouse style—.
- The application of OIT or TAL allowances to the normal time to obtain the standard time.
Throughout the article, a clear distinction is always drawn between time study (a measurement technique) and work sampling (a statistical technique of instantaneous observation), because they are complementary and are applied at different stages of the project.
1. Why a stopwatch and not work sampling in grape harvest
In grape harvest, three conditions coincide that make the stopwatch preferable to sampling:
- Short seasonality: the campaign lasts between 30 and 90 days depending on the Designation of Origin and the weather. For a cooperative receiving 4.000–10.000 kilos per day at peak harvest, sampling requires a minimum of 385 observations (95% confidence, p=q=0,5, e=±5%) distributed among operators, workstations and varieties. That investment of time is only justified when the activity is repeated over several months.
- Short, visible cycles: bunch cutting, tipping into crates, transport to the hopper, unloading and pressing have durations between 4 and 90 seconds, perfectly observable with a digital stopwatch.
- Variability between operators: the operator who cuts a bunch takes between 5 and 9 seconds depending on experience, variety and the condition of the grapes. That dispersion is exactly what the stopwatch makes it possible to capture.
Work sampling, by contrast, is efficient in the overall line audit stage (grape intake → destemming → pressing → must into tank) when there is a suspicion that a high percentage of time is lost in waiting between workstations. In that stage, a session of random observations at fixed intervals (several hundred or thousand readings, depending on the precision required) is enough to locate the bottlenecks.
2. The time study method applicable in the field
The recommended procedure rests on five steps, aligned with the practice described in classic work study manuals and adapted to the operation of a cooperative:
2.1. Study preparation
Before timing, the following is documented:
- List of workstations and operators (cutting, loading, transport, hopper, press).
- Expected volume and campaign duration.
- Current work method (tools, crate layout, distance to the hopper).
- Environmental factors affecting pace: temperature, humidity, terrain slope, presence of dust or plant debris.
At this point the representative activity that the technician will assign to each cycle as a pace factor is also decided. The Westinghouse system is one of the historical references for that assignment, but in CronometrasApp the rating is entered manually —the technician records the activity considered representative of the observed operator in each element, with no automation—.
2.2. Capturing times with the on-screen stopwatch
The application offers three modes:
- Stopwatch with reset to zero: each cycle is measured independently. Suitable for long cycles (≥60 s) such as pressing or hopper cleaning.
- Cumulative stopwatch (continuous timing): split times are accumulated to analyse the complete sequence. Useful when there are overlaps between operators or when the distribution of sub-times within a single cycle is of interest.
- Continuous timing with frequency: when an activity is repeated N times per cycle (for example, unloading 8 crates into the hopper), each repetition is timed and the application calculates the average and the frequency.
2.3. Number of observations required
For a repetitive activity with a known variability coefficient, Tippett's simplified formula provides an initial sizing:
In the worst case (p≈0,5, maximum variability) the formula yields 400 observations for an error of 5% (95% confidence, z≈2); if the observed dispersion is smaller, the required size decreases accordingly. The figure is used only as an initial sizing (illustrative example), never as a fixed requirement of the study. This is independent of work sampling, where the aim is to estimate a proportion of non-productive times; here the aim is to bound the mean of the timed time.
2.4. Performance rating and calculation of normal time
The technician assigns to each observation the representative activity observed. The application sums the times and applies the average activity factor. The result is the normal time (TN):
Where TO is the average observed time of the set of valid readings.
2.5. OIT or TAL allowances
The normal time is increased with allowances to obtain the standard time (TS):
The allowances reflect breaks, personal needs and fatigue. In grape harvest and olive mill operations, the main ones applied are:
- OIT allowances (Organización Internacional del Trabajo): recommended for repetitive, cyclical manual work. Typical coefficients range between 9% (seated operator, short cycle, cool environment) and 20% (standing operator, hot environment, forced posture in a hillside vineyard) (illustrative example).
- TAL allowances: an adaptation of the OIT tables with different reference values, applicable depending on the collective agreement or reference used by the company.
CronometrasApp makes it possible to define allowance tables configurable by activity (grape harvest cutting, grape harvest loading, olive mill reception, olive mill pressing, etc.) and by environmental condition (temperature, humidity, slope), so that the TS calculation is applied consistently with the workstation and the environment observed.
3. Specific application in grape harvest
The cycle values, cycles per day and allowance percentages in this section and the next (olive mill) are indicative starting ranges (illustrative example): each study must replace them with its own measurements and with the coefficients of the applicable collective agreement or table.
3.1. Cutting workstation
- Typical cycle: 5–9 seconds (bunch selection, cutting, placement in the crate).
- Cycles per day: 3.000–5.000 depending on the average bunch weight and operator performance.
- OIT allowances: 14–18% (standing posture, daytime heat, repetitive arm and wrist movements, sun exposure).
- TAL allowances: consult the agrifood collective agreement of the corresponding autonomous community, which sets the values applicable to manual grape harvest.
3.2. Loading and transport-to-hopper workstation
- Typical cycle: 90–180 seconds (loading 2–4 crates onto the trolley, transport of 30–80 metres, unloading into the hopper).
- Cycles per day: 80–150.
- Allowances: 11–14% (includes travel time between rows, occasional waits when meeting the vineyard tractor, and handling of loads).
3.3. Hopper reception
- Typical cycle: 60–240 seconds (tipping crates, visual quality inspection, removal of leaves and foreign objects).
- Cycles per day: 40–120.
- Allowances: 9–12% (longer cycles, less repetitive movements, more ergonomic posture).
4. Specific application in the olive mill
4.1. Reception yard and cleaning
- Typical cycle: 180–420 seconds (hopper → cleaner → washer → weighing).
- OIT allowances: 10–14% (line noise, humidity, handling of bulk olives).
4.2. Milling and malaxation
- Typical cycle: malaxation over a period of 20–40 minutes in the temperature-controlled malaxer (a process-controlled time, not operator-controlled).
- In this case, the time study focuses on the idle times between loads and on the operator's response time to alarms; the thermal cycle is not timed because it is determined by the temperature of the water in the malaxer and of the paste, not by the person.
4.3. Decanter and vertical centrifuge
- Typical cycle: continuous for 6–12 hours per batch.
- The time study is applied to the individual operator interventions (pressure adjustment, control of pomace outlet, transitions between batches). Here work sampling complements the stopwatch: while the stopwatch characterises the manual interventions, sampling estimates the percentage of time during which the operator is actually present at the machine versus the time the machine runs on its own.
4.4. Oil cellar and bottling
- Typical cycle on the automatic line: 4–8 seconds per container in the 5 litre format.
- Here the stopwatch is applied to format changeover time (SMED) and to unplanned stops. A cooperative with 4 bottling lines can move from 6 daily formats to 10 if the changeover times are well standardised —a direct impact on the cellar's capacity—.
5. Simulated practical case: winemaking cooperative with 1.200 members
Simulated practical case. Example constructed for teaching purposes from plausible industry parameters. It does not correspond to a real CronometrasApp implementation.
Brief. Cooperative with 1.200 members, 4.500 ha of vineyard in two Designations of Origin and an average production of 60.000.000 kg of grapes per campaign (≈ 42 million litres of wine). The grape harvest is contracted to crews of 12–18 operators for 60 days.
Scope of the study. 320 cycles per workstation (cutting, loading, transport, unloading into the hopper) were timed over 6 representative days, with variability coefficients between 8% and 14%.
Results by workstation (standard time with OIT allowances). Gross working day 8 h with 10% rest → effective working time ≈ 7,2 h = 25.920 s. The cycles per day are obtained by dividing the effective time by the TS:
| Workstation | Average TO | Activity factor | TN | OIT allowance | TS (s/cycle) | Cycles/day (8h, 10% rest) |
|---|---|---|---|---|---|---|
| Bunch cutting | 6,8 s | 1,00 | 6,8 s | 16% | 7,9 s | ≈ 3.280 |
| Crate loading | 142 s | 1,00 | 142 s | 13% | 161 s | ≈ 161 |
| Transport to hopper | 88 s | 1,00 | 88 s | 13% | 99 s | ≈ 261 |
| Unloading and hopper cleaning | 105 s | 1,00 | 105 s | 11% | 117 s | ≈ 221 |
Interpretation. For a typical crew of 14 operators (10 cutters + 4 who cover the loading, transport and unloading workstations consecutively), the standard work per kilo is obtained by adding the four workstations referred to their own cycle unit: cutting (7,9 s per bunch of 1,25 kg ≈ 6,3 s/kg) and the three subsequent workstations (161 + 99 + 117 = 377 s per batch of ≈ 66 kg ≈ 5,7 s/kg), a total of ≈ 12 seconds of standard work per kilo. With 8 gross working hours and a 10% rest factor (7,2 effective h = 25.920 s), a cutter produces ≈ 3.280 cutting cycles, equivalent to ≈ 4.100 kg in cutting if the average bunch weight is 1,25 kg; an operator handling the three subsequent workstations in sequence takes ≈ 377 s per complete cycle and completes ≈ 68 cycles per day, equivalent to ≈ 4.500 kg received per operator. The typical crew (10 cutters + 4 support operators) therefore harvests ≈ 41.000 kg/day (10 × 4.100 kg) and the 4 support operators receive ≈ 18.000 kg/day (4 × 4.500 kg), so the reception workstations are the bottleneck of the crew (illustrative example).
Resulting actions. The study revealed that 18% of the haulier's time was consumed in waits at the hopper entrance (bottleneck). The corrective action —expanding the reception hopper with a second unloading point— reduced waits to 6% and raised the crew's overall output by 7%.
6. Common mistakes in cooperatives
- Timing all year round with the same allowances. The OIT allowances vary between grape harvest (heat, forced posture) and cellar work (controlled environment, more stable postures). Applying the general 9% in the middle of August underestimates the standard time.
- Forgetting the transition between workstations. In grape harvest, much of the non-productive time is not at the workstation but in moving between rows. Timing only the main workstation without recording waits leads to unrealistic standards.
- Comparing cycles from different varieties. A plot of bush-trained Tempranillo and a plot of trellised Cabernet Sauvignon have very different cutting cycles. The standard must be segregated by pruning method and by variety.
- Confusing work sampling with time study. Sampling estimates proportions of time (percentage of non-productive time) over long periods. The stopwatch characterises the average time per cycle. They are complementary techniques, not substitutes.
7. Complementarity with work sampling
In an overall audit of the grape harvest or olive mill line it is advisable to combine both techniques:
| Business question | Technique | Quantity to estimate |
|---|---|---|
| How long does each cutting cycle take with the representative operator? | Time study | Average time per cycle, in seconds |
| What percentage of time is lost waiting at the hopper entrance? | Work sampling | % of waiting observations over the total |
| How many man-days are needed to harvest 4 million kg? | Time study + allowances | Standard time per cycle × no. of planned cycles |
| Is the hopper the bottleneck of the process? | Work sampling | % of observations with operator idle vs. % with hopper saturated |
When both techniques converge (the stopwatch bounds the average time per cycle and sampling bounds the proportion of non-productive time), the resulting standard is robust and defensible before an internal audit or a labour inspection.
8. Closing: fit with the Cronometras ecosystem
The time study in grape harvest and olive mill operations is a prototypical case of time study with a digital stopwatch on short and variable cycles. It fits the operation of CronometrasApp:
- Capture with the on-screen stopwatch (reset to zero, cumulative or frequency) on the cutting, loading, transport and unloading cycles.
- Rating of the representative activity entered by the technician —not automated—.
- OIT or TAL allowances configurable by activity and environmental condition.
- Generation of reports in PDF, Excel or JSON with the complete calculation chain to present to the cooperative's governing board or to an external prevention service.
For studies seeking to estimate the overall percentage of non-productive time in the cellar, the natural alternative is work sampling on the complete line with the Worksamp app, which applies Tippett's formula to the number of observations calculated on the basis of the desired precision and confidence.
And for the working-time control of the crews during the campaign —where variability is high and labour regulations require working hours, breaks and overtime to be reliably recorded—, the Induly app covers capture from the operator's or crew leader's mobile phone, with export of time sheets to Excel/PDF for the cooperative's manager.
References consulted
- Agencia de Información y Control Alimentarios (AICA), closing data for the 2025/26 season published by the Ministry of Agriculture, Fisheries and Food: Olive oil production 1,29 Mt.
- Organización Internacional de la Viña y el Vino (OIV), first estimate of world production 2025: OIV.
- Regulation (EU) No 1308/2013 of the European Parliament and of the Council of 17 December 2013 establishing a common organisation of the markets in agricultural products and repealing Council Regulations (EEC) No 922/72, (EEC) No 234/79, (EC) No 1037/2001 and (EC) No 1234/2007. EUR-Lex 32013R1308.
- Organización Internacional del Trabajo (OIT), tables of allowances over normal time for determining standard times for repetitive manual work.
Don't want to do it yourself? We do it for you from €800
If you prefer to outsource it, Cronometras delivers a complete time and motion study from a single video: elemental breakdown, OIT/TAL fatigue allowances, standard time with tolerances, and a report in PDF + Excel + JSON ready to present to management.