What Is a Bimanual Diagram? Definition and Technical Foundations
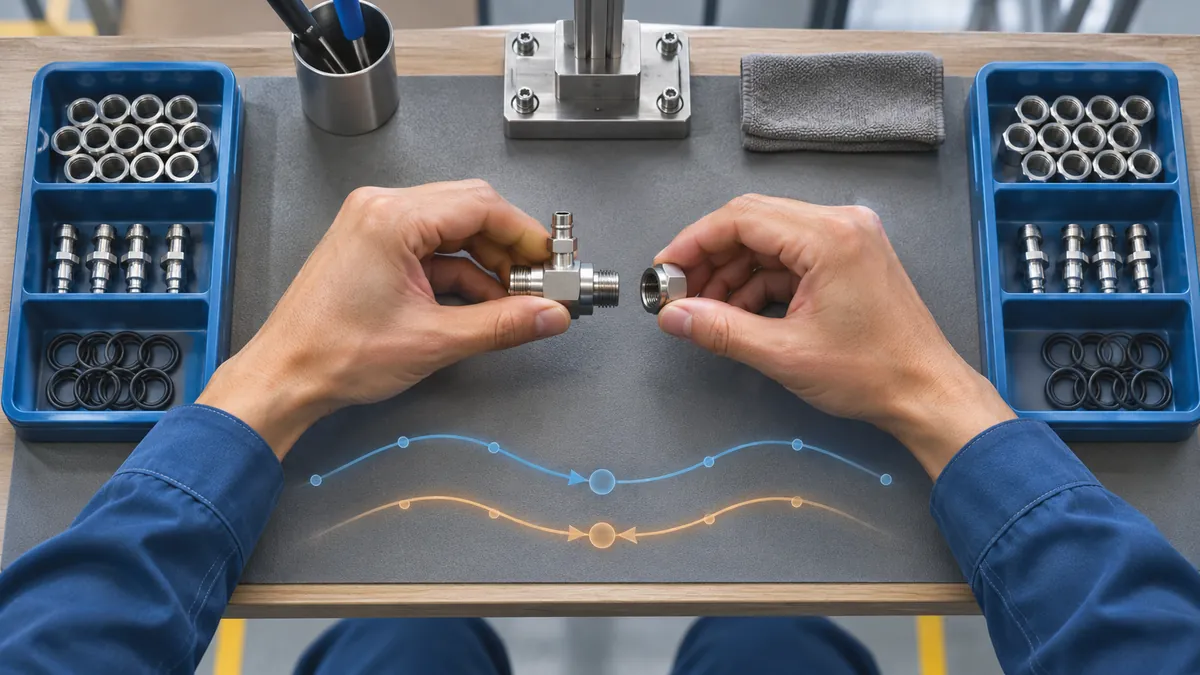
The bimanual diagram, known in Anglo-Saxon technical literature as the Two-Hand Process Chart or SIMO Chart (Simultaneous Motion Chart), is the most detailed analysis tool within methods engineering. Its purpose is to record and break down, simultaneously, the activities carried out by the left hand and the right hand during a manual, repetitive work cycle.
Unlike an operation or process chart, which records general steps, the bimanual diagram operates at the level of micromovements. This fine breakdown makes it possible to visualize the coordination between both hands with surgical precision, identifying imbalances and unproductive movements that would go unnoticed in a superficial observation.
The elements recorded in this diagram are an adaptation of the ASME symbols, but applied to each hand separately:
- Operation (○): An intentional change in the physical or chemical characteristics of an object (e.g., screwing, bending).
- Transport (→): The movement of a hand, loaded or unloaded, from one place to another.
- Hold (D): Holding an object motionless. It is an unproductive movement par excellence.
- Wait (▽): Idle hand, with no assigned task.
- Inspection (□): Verification of a characteristic of the object.
The true analytical power of the bimanual diagram emerges when it is cross-referenced with the 18 Therbligs identified by Frank and Lillian Gilbreth. Each of the previous categories is broken down into these basic movement elements. Efficient therbligs such as Grasp (G), Release (RL) or Use (U) represent added value. Conversely, inefficient therbligs such as Hold (H), Search (Sh) or Avoidable Delay (UD) are the main target of optimization. This taxonomy, established since 1924, remains the de facto standard, recognized by standards such as ISO 15539:2023 on manual handling and the technical guidelines of the International Labour Organization (ILO).
What It Is Used For: Practical Applications in Today's Industry
In a context of increasing automation, the value of bimanual analysis is not only maintained, but is being reassessed. The tasks that remain in human hands are precisely those that require dexterity, tactile judgment or adaptability to variations: the exact point where the efficiency of the manual method becomes a critical competitiveness factor.
The sectors of highest application are those with intensive manual assembly processes and strict quality requirements:
- Automotive: In final assembly lines, harness wiring, installation of electronic modules or fitting of interior trim. An imbalance between hands can generate bottlenecks and differential fatigue in the operator.
- Electronics: In the manual soldering of SMD components, the assembly of PCBs, the wiring of delicate connectors or the packaging of products sensitive to electrostatic discharge.
- Medical Devices: In the precision assembly of surgical sub-assemblies, handling in clean rooms and sterile packaging, where every movement must be minimized and controlled.
- Food and Pharmaceutical: In primary handling, packaging, labeling and conditioning tasks, where repetitiveness and speed must be balanced with ergonomics.
The main objective is always the same: identify and eliminate unproductive therbligs. Does the left hand spend most of its time holding while the right hand works? Are there avoidable wait or search times? The bimanual diagram makes these problems visible so that the method can be redesigned, seeking greater symmetry, smoothness and efficiency.
How It Is Prepared: Step-by-Step Methodology
Preparing a rigorous bimanual diagram follows a structured methodology that guarantees the reliability of the data and the validity of the subsequent analysis.
Step 1: Direct observation and recording. The starting point is the careful observation of the skilled operator performing the task. This can be done in real time or, preferably, by filming. A high-speed camera or slow-motion mode makes it possible to capture details imperceptible to the human eye, such as micro-pauses or positionings.
Step 2: Breakdown of the task into therbligs. Using the recording or the observation notes, each complete cycle is broken down into its elementary micromovements, classifying them according to the list of 18 therbligs. This is the most critical phase and requires specific training for correct identification.
Step 3: Simultaneous recording in a bimanual chart. A chart is created with two main columns (left hand and right hand) and a common time scale on the left. Each identified therblig is recorded in the corresponding time row and in the column of the hand that performs it, using the standardized graphical symbols.
Step 4: Bilateral balance analysis. The resulting chart is analyzed. The percentage of time each hand spends on efficient versus inefficient therbligs is calculated. The ideal is a balance where both hands work simultaneously on added-value tasks, minimizing the periods of holding or waiting.
Step 5: Redesign of the method for symmetry and efficiency. With the data clear, the methods engineer proposes improvements. This may involve:
- Introducing holding devices (clamps, fixtures) to free the hand that only holds.
- Reorganizing the layout of the parts (delivery point) to reduce empty transports and searches.
- Standardizing the sequence of movements so that both hands start and finish their tasks in a coordinated manner.
Technological Evolution: Software and Automation in 2025
The bimanual diagram has ceased to be an exclusively analog tool, based on paper and stopwatch. Its integration with digital technology is redefining its application and scope.
Specialized software such as TiCon (for MTM), MOST Works or ProPlanner makes it possible to generate bimanual diagrams directly from MTM or MOST code sequences. These tools automate recording and calculation, reducing human error and speeding up the analysis.
Perhaps the most significant leap is markerless motion capture (markerless motion capture). Through computer vision algorithms and artificial intelligence, systems such as those being developed by various startups can analyze videos of manual tasks and:
- Automatically identify the work cycles.
- Propose a preliminary classification of the therbligs performed.
- Generate a draft of the digital bimanual diagram.
Integration with predetermined time systems is the dominant trend. The bimanual diagram is no longer an end in itself, but the first step in a digital methodological chain: from observation to the diagram, from therblig classification to MTM-1 or MOST coding, and from there to the predetermined time database that feeds the standards of the entire plant. Tools such as those offered by specialized consultancies facilitate this transition from the observed data to the calculated standard.
Relationship with Other Work Measurement Systems
The bimanual diagram does not exist in a methodological vacuum. It is a key piece that connects with other methods and time engineering tools.
It is, above all, an essential prior step for MTM or MOST coding. Before assigning codes and predetermined times to a sequence, it is essential to visualize the interaction between both hands. The diagram reveals whether the sequence is logical and balanced, providing the "map" on which the time systems will be applied.
There is a subtle difference from the complete micromotion study. Traditionally, the micromotion study (micromotion study) encompasses the entire process: filming, breakdown, SIMO chart and redesign. In modern industrial practice, the term "bimanual diagram" usually refers to the complete process, especially when carried out through direct observation assisted by digital tools.
Its complementarity with the timed time study and OEE is total. While time study measures how much time a task takes, the bimanual diagram explains the why of that time. A task with low OEE due to irregular cycle times may originate in an unbalanced bimanual method, where one hand constantly waits for the other. For real-time production control, platforms such as Induly provide execution data which, combined with a methods analysis, make it possible to diagnose deep-rooted inefficiencies.
Training and Required Skills
Mastering the bimanual diagram requires a combination of theoretical knowledge and practical skill that is acquired in university training and refined with experience.
In the curricula of Industrial Engineering degrees in Spain, this tool is taught mainly in subjects such as:
- Methods Engineering
- Production Organization
- Work Study
- Industrial Ergonomics
Beyond formal education, there are recommended certifications that validate professional competence:
- MTM Training: Especially the MTM-1 and MTM-2 levels, which teach how to break down and analyze movements with the rigor of predetermined time systems.
- Industrial Ergonomics Courses: To understand the impact of methods on worker health and workplace design.
The key skills an analyst must possess are:
- Analytical observation: The ability to see beyond the overall gesture and break it down into its basic elements.
- In-depth process knowledge: Understanding what the product does and what the quality standard is.
- Mastery of therbligs: Classifying them quickly and accurately is the core of the analysis.
- Redesign thinking: Not only diagnosing problems, but proposing practical and ergonomically viable solutions.
Frequently Asked Questions (FAQ)
What is the difference between a bimanual diagram and a process chart? The process chart (such as the ASME operations chart) records the main transformation steps of a product, without distinguishing which hand performs each action. The bimanual diagram focuses on the operator, breaking the task down at the micromovement level and showing the simultaneous activity of both hands. It is therefore a much more granular analysis tool.
Which therbligs are considered inefficient and how are they eliminated? The main inefficient therbligs are: Hold (H), Search (Sh), Select (St), Position (P), Inspect (I) and Delays (UD, AD). To eliminate them, motion economy principles are applied: use fixtures to eliminate holding, standardize the delivery point to eliminate searching, and pre-position parts (Pre-Position, PP) to minimize positioning.
Is it necessary to film the cycle to create a bimanual diagram? It is not strictly necessary, but it is highly recommended. Filming allows repeated observation, at reduced speed and from different angles, which guarantees a more precise breakdown of the therbligs. For very fast or complex tasks, it is almost essential. Work sampling, facilitated by applications such as WorkSamp, can complement this analysis to validate frequencies.
Which software is most suitable for small and medium-sized enterprises? For SMEs beginning their journey in methods analysis, there are scalable options. Starting with standardized Excel templates is viable. Later on, one can opt for specialized cloud solutions with subscription models, such as those listed in the ASETEMYT Industrial Time Study Directory. The key is to choose a tool that allows manual data entry and generates the diagrams and basic balance calculations.
How is the bimanual diagram linked to productivity and OEE? A poorly designed bimanual method generates irregular cycle times, fatigue and a higher probability of errors, which directly impacts the Availability and Performance of OEE. By optimizing the method, the cycle is stabilized, fatigue is reduced (improving quality) and the sustainable speed is increased, thereby raising the overall OEE of the production cell or line.
Resources and Tools
To delve deeper into the practical application of the bimanual diagram and other work measurement techniques, the following resources are recommended:
- ASETEMYT - Industrial Time Study Directory: Find suppliers, software and specialized consulting in time and methods study.
- ASETEMYT Blog: Technical articles and case studies on industrial productivity.
- Induly: Production Control and Industrial Time & Attendance software to monitor execution in real time.
- WorkSamp: Specialized application for performing Work Sampling studies (Work Sampling) quickly and accurately.
- Add your company to the directory: If you offer time study, methods engineering or related software services, you can become part of the directory.
Don't want to do it yourself? We do it for you from €800
If you prefer to outsource it, Cronometras delivers a complete time and motion study from a single video: elemental breakdown, OIT/TAL fatigue allowances, standard time with tolerances, and a report in PDF + Excel + JSON ready to present to management.