Optimizing the man-machine relationship is one of the fundamental pillars of modern methods engineering. In semi-automated production environments, where an operator must supervise or intervene in multiple machines, the accurate calculation of operator saturation becomes a critical indicator for workplace design, line balancing and maximizing OEE (Overall Equipment Effectiveness). This article provides an exhaustive technical guide, based on ILO standards and predetermined time systems (PTS), for its calculation and interpretation.
Pillar 1: Theoretical and Conceptual Foundations
What Is Operator Saturation? Definition According to the ILO
According to the guidelines of the International Labour Organization (ILO), operator saturation (or operator saturation) is defined as the percentage of the machine cycle time during which the operator is occupied with assigned tasks requiring direct intervention. These tasks include manual handling, loading/unloading, transport, inspection and adjustments.
It is crucial to distinguish this concept from that of efficiency. Saturation measures the proportion of occupied time with respect to the total cycle time, regardless of the quality or productivity of that work. An operator may be saturated at 95% but applying an inefficient method, which would result in low efficiency. Efficiency compares the standard time with the actual time used, whereas saturation analyzes the workload within a given cycle.
The fundamental formula is:
Saturation (%) = (Σ Manual Times / Machine Cycle Time) × 100
Where:
- Σ Manual Times: Sum of all work elements requiring active intervention by the operator within a complete cycle.
- Machine Cycle Time: Time interval from the start of an automatic process to the start of the next one, including the processing time (machine time) and the manual loading/unloading times.
The Man-Machine Chart: Essential Tool
The simultaneous man-machine chart is the indispensable graphic tool for this analysis. It allows the interdependence of activities to be visualized and times to be classified into four key categories:
- Machine Time (M): Automatic operation in which the machine works without human intervention. The operator may be idle or attending another machine.
- Man Time (H): Manual operation requiring the operator's attention, during which the machine is stopped or waiting.
- Combined Time (C): Actions occurring simultaneously, such as the visual inspection of a part while the machine runs an automatic cycle on another unit.
- Idle Time (I): Non-productive dead time, whether due to flow imbalance, lack of materials or waiting.
Interpreting this chart immediately reveals bottlenecks and the potential for task redistribution.
Critical Variables Affecting Saturation
Saturation is not a fixed value; it is influenced by multiple operational factors:
- Ratio between automatic and manual times: A very long machine cycle with a brief manual intervention leads to low saturation, ideal for multiple machine assignment.
- Walking and transport times: Moving between workstations can be a significant component of non-productive manual time.
- Inspection and quality control times: Often, these tasks can be overlapped with machine time (combined time), improving saturation without extending the cycle.
- Setup times (setup): In short production cycles, setup can dominate the workload, distorting the per-unit saturation calculation.
Pillar 2: Practical Calculation Methodology (Step by Step)
Data Collection: Measurement Methods in 2025
The accuracy of the calculation depends on the quality of the data. Current methods combine classic techniques with digital technology:
- Time study: It remains valid, especially the continuous and regression methods, for establishing base times. It must be carried out in accordance with standard UNE-EN ISO 24452 to ensure repeatability.
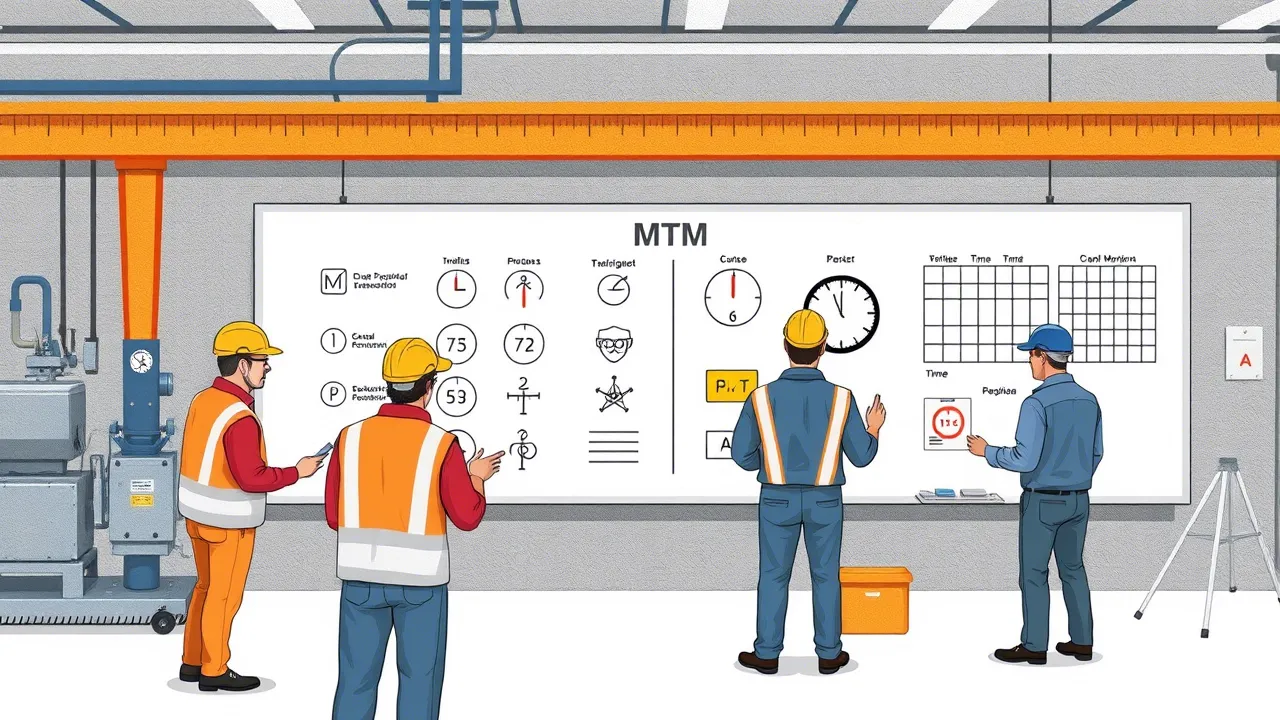
- Predetermined Time Systems (PTS): For greater precision and universality, systems are used that break work down into basic motions with assigned times.
- MTM-1 (Methods-Time Measurement): Offers great detail for complex, high-precision manual operations.
- MOST (Maynard Operation Sequence Technique): More agile than MTM-1, ideal for repetitive handling and transport sequences, common in machine attending.
- MODAPTS (Modular Arrangement of Predetermined Time Standards): A more simplified and quickly applied system, widely used in industry to standardize tasks with moderate variability.
- Work Sampling (Work Sampling): A statistical method in which random instantaneous observations are made throughout the shift. It is excellent for validating the results of other methods and for analyzing processes with very long or irregular cycles. Digital tools such as WorkSamp automate the capture and statistical analysis of these data, increasing their reliability and reducing the analyst's effort.
Detailed Calculation with a Technical Example
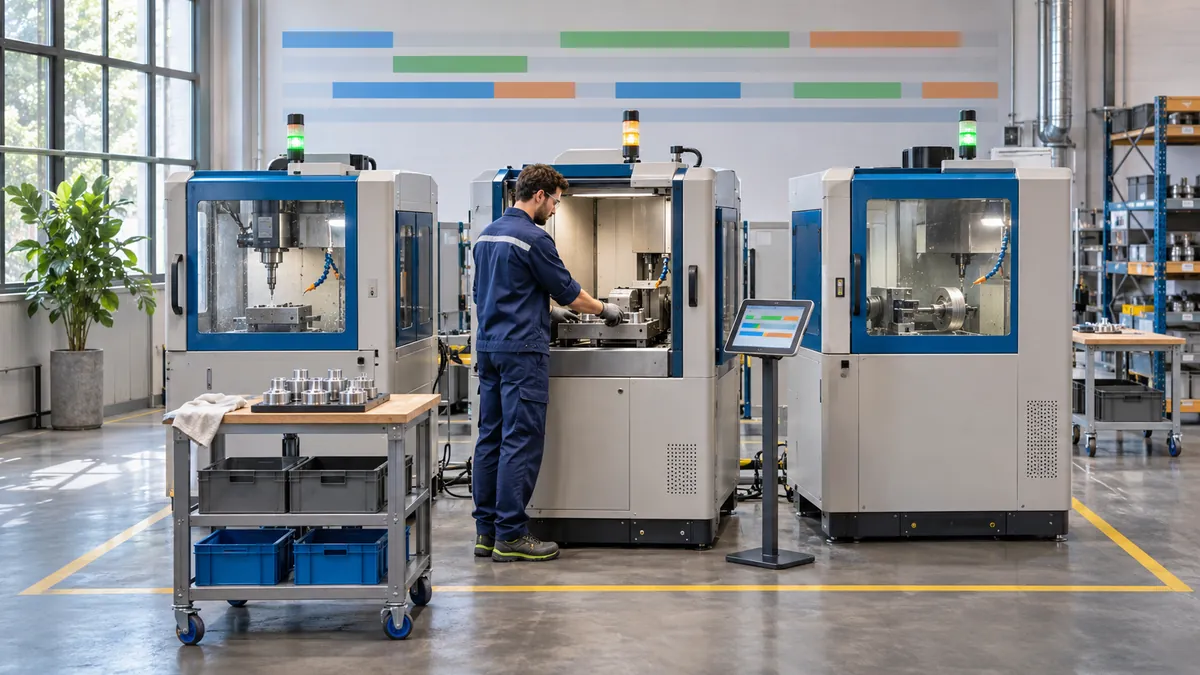
Scenario: An operator attends two identical injection molding machines (M1 and M2). The automatic cycle of each machine (from mold closing to mold opening) is 120 seconds. A time study is conducted using time study (stopwatch) and validated with MODAPTS data.
Table of Manual Elements per Machine Cycle (M1):
| Work Element | Time (s) | Observation |
|---|---|---|
| Remove finished part from M1 | 15 | Man Time (H) |
| Place insert in M1 mold | 20 | Man Time (H) |
| Visual inspection of M2 part | 10 | Combined Time (C) - Performed while M1 is in its automatic cycle. |
| Walking from M2 to M1 | 5 | Man Time (H) |
| Total Manual Time per M1 Cycle | 50 s |
Saturation Calculation:
- Identify the Cycle Time (Tc): Tc = 120 s (automatic time of M1).
- Sum the Manual Times (Tm): Tm = 15 + 20 + 5 = 40 s. Note: The 10 s of inspection of M2 are not added to the manual time assigned to the M1 cycle, since they are performed in parallel with the cycle of another machine and do not interfere with attending M1. It is a productive use of machine time.
- Apply the Formula: Saturation = (Tm / Tc) × 100 = (40 s / 120 s) × 100 = 33.33%
Interpretation: The operator is occupied 33.33% of each machine's cycle time attending it. This indicates significant idle capacity (66.67%), suggesting that the operator could potentially attend a third machine without overload, provided the walking and sequencing times allow it.
Regulatory Adjustments for Accurate Calculation (ILO 2025)
The initial calculation must be adjusted to obtain a fair and sustainable time standard:
- Physiological Rest Breaks: According to standard ISO 11228-3 on physical effort, a percentage for rest is added. For a moderate workload, 5% is usually applied.
- Fatigue and Personal Delays: The ILO recommends an additional factor, typically between 3% and 5%, depending on the workplace conditions (noise, posture, monotony).
- Adjusted Formula:
Adjusted Manual Time = Manual Time × (1 + Rest Factor + Fatigue Factor)Adjusted Saturation = (Adjusted Manual Time / Cycle Time) × 100
Following the example (with 5% rest and 4% fatigue): Adjusted Tm = 40 s × (1 + 0.05 + 0.04) = 40 s × 1.09 = 43.6 s Adjusted Saturation = (43.6 s / 120 s) × 100 = 36.33%
This adjusted value is the one that must be used for the final workplace design and the calculation of the optimal number of machines per operator.
Pillar 3: Industrial Application, Regulations and Optimization
Current State in Spanish Industry (2025)
The adoption of analytical tools for man-machine analysis has grown exponentially, driven by Industry 4.0.
- Level of Adoption: According to data from the Spanish Association of Time Engineers (AET), more than 78% of industrial plants in sectors such as automotive, food and metalworking use man-machine charts for line balancing. However, a digital gap exists: while large corporations use advanced software, many SMEs still rely on visual observations and spreadsheets.
- Digital Tools:
- Simulation Software: Platforms such as Tecnomatix Plant Simulation or FlexSim make it possible to create digital twins of the plant, where the assignment of operators to machines can be modeled and optimized before implementing physical changes.
- IIoT (Industrial Internet of Things): Sensors connected to the machines automatically capture cycle times, stops and states, providing real-time data for the dynamic calculation of saturation. A production control and industrial time-tracking software such as Induly can integrate these machine data with operator information, offering a consolidated view of workload and productivity in real time.
Regulations and Reference Standards in Spain
The calculation of saturation is not only a matter of productivity, but also of regulatory compliance in occupational safety and health.
- UNE-EN 1005-4:2024 - Safety of machinery. This standard establishes the principles for the evaluation of human factors, paying particular attention to the demands of reaction and intervention times in semi-automatic operating modes. A correct saturation calculation helps ensure that the operator has enough time to intervene safely.
- Royal Decree 486/2024 on the prevention of occupational risks. Its annex on workloads requires companies to assess the risks associated with physical and mental workload. In workplaces involving the attending of multiple machines, an excessively high saturation (close to or above 85-90% adjusted) may indicate psychophysical overload, stress and a greater risk of error or accident, which obliges the employer to take corrective measures.
Optimization and Balancing Strategies
Once saturation has been calculated, strategies are applied to optimize it:
- Multiple Machine Assignment (Manning Multiple): This is the direct application of the analysis. The formula to determine the theoretical maximum number of machines (N) that an operator can attend is:
N = (Machine Cycle Time) / (Adjusted Manual Time per Machine)In our example: N = 120 s / 43.6 s ≈ 2.75 machines. This indicates that, theoretically, the operator can attend 2 machines with slack, and the feasibility of a third could be studied if manual times are reduced. - Reduction of Manual Times: Applying methods engineering (principles of motion economy) to simplify the loading, unloading and transport tasks.
- Task Overlapping (Combined Time): Designing the method so that activities such as inspection or area cleaning are performed during the machine's automatic time.
- Continuous Improvement Cycle: Saturation is not a static figure. It must be monitored and recalculated periodically, especially in the face of changes in products, methods or technology. Integrating production data into digital platforms facilitates this constant monitoring.
In conclusion, the rigorous calculation of operator saturation, grounded in international standards and supported by digital tools, is a strategic exercise for any industrial engineer. It enables informed decision-making on workplace design, automation investment and, above all, ensures an optimal balance between asset productivity (OEE) and the well-being and safety of human capital.
Don't want to do it yourself? We do it for you from €800
If you prefer to outsource it, Cronometras delivers a complete time and motion study from a single video: elemental breakdown, OIT/TAL fatigue allowances, standard time with tolerances, and a report in PDF + Excel + JSON ready to present to management.