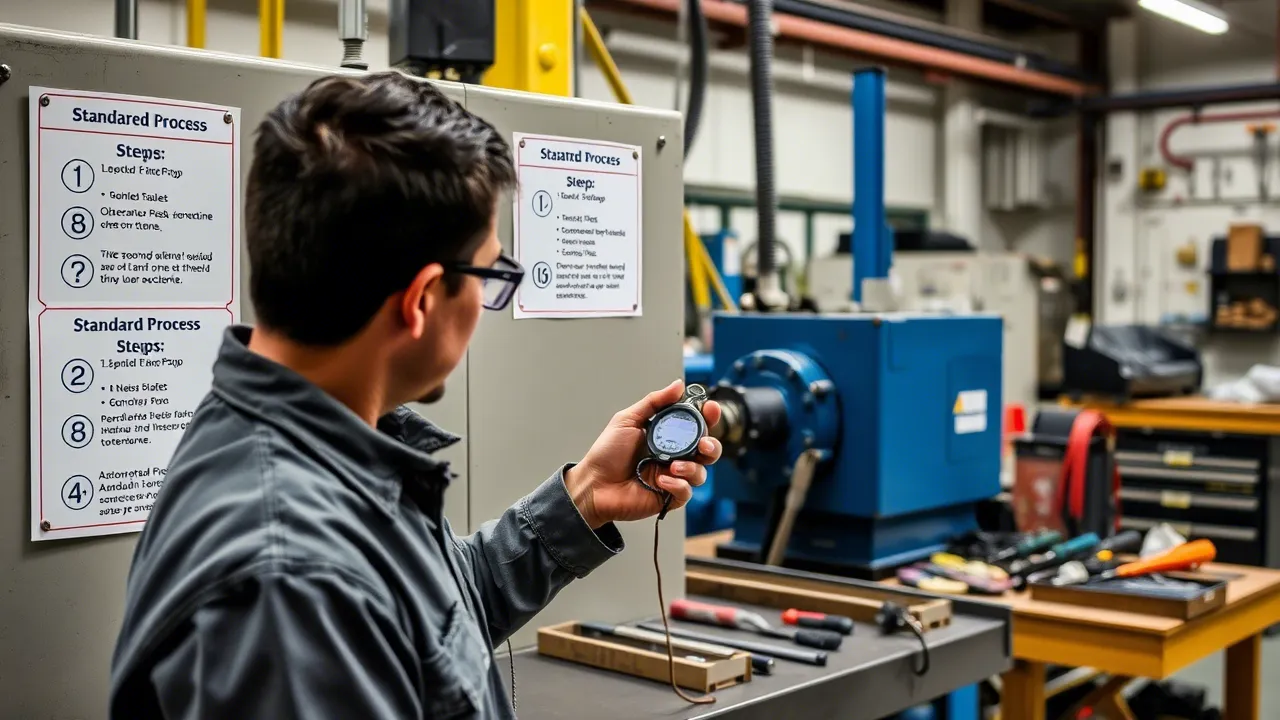
When a medium-voltage cell fails, the bill is not limited to the spare part and the technician's hour: it is counted in stopped lines, orders that do not ship and customers who do not receive. And the underlying problem is rarely the cell: it is that no one knows how long each intervention takes, how much a failure costs or how much time goes into waiting and travel. Without that data, planning is impossible and any delivery commitment rests on estimates.
This article explains how to obtain reliable times for that maintenance and turn them into decisions: what to prevent, what resources to justify and how much is saved by moving from firefighting to planning. It is illustrated by a simulated practical case: the cost fell from 78.750 €/year to 63.000 €/year, a net saving of 15.750 €/year (20%), without changing a single cell.
What Is Happening in Your Plant
In most plants, maintenance of cells, circuit breakers and transformers works by reaction: action is taken when something fails. That way of working has four business consequences:
1. The repair lead time is an unknown. Some waits are physical and cannot be shortened: after opening a circuit breaker under load, the equipment needs a rest period before it can be operated again, which depends on the device (for example, the ABB HD4/R manual, source, sets out rated operating sequences with dead times from 0,3 to 3 min). Others are avoidable: looking for tools, consulting the supervisor, waiting for the spare part. As long as both are mixed together in the same "repair time", you cannot promise a reliable deadline.
2. The real cost of each failure goes unaccounted for. If you only add up parts and technical hours, you forget the most expensive item: the production that is not done. In the case below, the full cost of a cell failure was 22.500 €. That is the figure you must use to decide how much to invest in prevention.
3. Safety eats up time without anyone measuring it. The mandatory protocol before touching any energized equipment —the five golden rules: disconnect, prevent energy feedback, verify absence of voltage, earth and short-circuit, and signal the area, according to standard UNE-EN 50110-1 on operations and safety in electrical installations— adds about 15-25 min (indicative range) to each intervention. And the risk is lethal: an electric arc kills at a distance (energy limits of NFPA 70E). Whoever plans without counting that time underestimates the work by between 8% and 12% (indicative range) and the plan is missed from the very first week.
4. Without data, the preventive plan does not get approved. The question from finance is always "how much does it cost and how much does it save?", and without measured times and a quantified failure cost the answer is a slogan.
The context is not small either: according to Red Eléctrica (source), the Spanish transmission network exceeds 46.000 km of line circuits and has hundreds of substations; distribution operators run the medium-voltage network of the industrial estates.
How It Is Solved: Measure to Decide
The solution is not more staff or more overtime: it is knowing where your crew's time goes and how long each task takes, with data. This is achieved by combining two complementary measurements.
Measurement 1: time study of the tasks (Cronometras). With Cronometras the actual interventions are measured —an operation, an annual cell maintenance, the replacement of a fuse— and converted into a reference time that includes legally applicable breaks and contingencies (ILO and TAL allowances). That time is, ultimately, what manufacturing costs you when your plan depends on maintenance: the basis for sizing the crew, calculating the cost of each hour of downtime and planning the intervention windows. The application exports to PDF, Excel or JSON for your cost system or the presentation to the board.
Measurement 2: work sampling (WorkSamp). Timing task by task does not tell you where the rest of the working day goes. With WorkSamp instantaneous observations are taken throughout the actual working days —the application calculates the number of observations required for 95% reliability— and the time is split into four buckets, in plain terms:
- What adds value: the technician modifies the equipment (wiring, tightening with controlled torque, replacing a fuse, programming a relay).
- What adds value and also protects lives: the five golden rules, verification of absence of voltage, earthing and signalling: real, mandatory work that must be paid for and planned as such. Thermography, insulation measurement or dissolved gas analysis of the oil also belong here: this is the information that prevents the future failure.
- What adds no value: looking for tools, walking the corridors without materials, re-reading the procedure: the only thing that can be cut back, and that is where the saving appears.
- Unavoidable waits: the physical times of the equipment (cooling of terminals, draining of dielectric oil, pressurization of the gas) and waits due to logistics, staffing or failure. They are not the technician's fault nor do they count as their performance, but they must be planned: they lengthen the intervention lead time.
Classic trap: the operator who "waits with the stopwatch in hand" while the equipment cools down looks slow, and the time is imposed by the physics of the device. Properly classified work sampling avoids asking for overtime where what is missing is a working method.
What decisions do these data enable? The three that move the budget: which tasks to standardize (so that they take the same time today and six months from now), which spare parts to hold in the plant (so as not to pay for waiting) and which outages to plan and what risk to accept.
The IEC 62271 series (official catalogue) brings together the standards for high-voltage switchgear: IEC 62271-100:2021+AMD1:2024 covers circuit breakers (with mechanical endurance classes M1 and M2 and their associated endurance tests), IEC 62271-102:2021 covers disconnectors and earthing switches and IEC 62271-203:2022 covers gas-insulated metal-enclosed switchgear. None of them sets maintenance schedules or specific maintenance values: those data belong to the instructions of the manufacturer of the installed equipment. Planning a 24 kV MV cell is not the same as planning a 145 kV GIS: the schedule must come from the installed equipment. Best practices in substation asset management and maintenance are gathered in the sector's technical literature, such as the CIGRE Green Book B-5 Substations (source).
The calculation is simple: legal and work allowances (indicative coefficients) are added to the stopwatch time —for an MV cell, 10% fixed for breaks, 15-25% variable for contingencies and effort and 5% for the safety verifications—: the intervention is planned as ×1,30 to ×1,40 of the time at the cell, or ×1,20 to ×1,25 if it already includes physical waits of the equipment. And availability —what your production notices— is the time between failures divided by that time plus the repair time: with failures roughly every 30 months and repairs of 4 h (indicative values for new MV cells with well-executed preventive maintenance) it is around 99,98%; with cells over 15 years old and failure-based maintenance, the time between failures drops to 8-12 months and the repair rises to 18-24 h.
How Long Each Intervention Takes and What It Means for Your Planning
Example indicative reference times for Spanish industrial plants (the central values are medians; the ranges, the spread between crews). They help you anticipate outage windows and allocate resources:
| Intervention | Field duration | With allowances | Effect on your planning |
|---|---|---|---|
| Thermography of 24 kV MV cell (without opening) | 8 min | 11 min | No production stoppage |
| Insulation measurement (5 kV megger) | 15 min | 21 min | Same |
| Dissolved gas analysis of oil (sampling) | 25 min + 14 days of laboratory | 35 min (sampling only) | Order it two weeks in advance |
| Opening and closing operation of cell (no load) | 6 min | 8 min | Fits into any gap |
| Annual maintenance of MV cell (cleaning, retightening, verification) | 95 min | 130 min | Half a morning per cell |
| Every 4 years maintenance of 145 kV HV circuit breaker (with contact replacement) | 8 h | 11 h | A full-day outage |
| Dielectric recovery after opening under load (MV 24 kV) | 30 s | — | Physical wait, cannot be cut |
| Gas pressurization after intervention in MV cell | 4 min | — | Physical wait, cannot be cut |
| Draining and filling oil in 630 kVA transformer | 6 h + 8 h + 12 h of degassing | — | More than one day: plan it in advance |
| Fault location in MV cell (no spare part) | 2-6 h | — | This is where the spare part held in the plant comes in |
| Replacement of MV fuse after short circuit | 45 min | 60 min | Can be resolved the same morning |
| Reclosing of circuit breaker after trip | 12 min | 16 min | Can be resolved the same morning |
Simulated Practical Case: 12 MV Cells and 24 Months of Follow-Up
Simulated practical case. Example built for teaching purposes from plausible industry parameters. It does not correspond to a real implementation of Cronometras nor to any specific customer.
Context: food-sector plant with 12 MV cells of 24 kV feeding 4 production lines. Maintenance was pure failure-based. The objective: size a preventive plan and demonstrate the saving before presenting it to the board.
Starting point (month 0). In the 24-month history there were 7 failures, with a time between failures per cell of about 41 months across the whole period and a mean time to repair of 18 h (range 4-72 h). Each failure cost 22.500 € between lost production, spare parts and technical hours: 78.750 €/year (7 failures/24 months × 12 months × 22.500 €). The work sampling of the 6 corrective interventions —with the number of observations calculated by the application for 95% reliability— broke down the time as follows: 24% value added, 11% safety, 2% diagnostics, 18% non-value-added time, 19% waits due to equipment failure, 11% logistics waits, 9% staffing waits and 6% other.
Diagnosis. That 18% of non-value time —≈1 h per 6 h work order— was non-standardized method: each technician applied the five golden rules in a different order, with trips back and forth to the workshop. The 2% of diagnostics was the lack of planned thermography: the relays tripped without warning. And the 19% of waits due to failure were spare parts held outside the plant, with waits of 4 to 12 h until the central warehouse.
Crash plan (months 1-3). A single order for the five golden rules, with a signed checklist. And a kit of critical spare parts in the plant: 3 fuses, 2 trip coils and 1 protection relay spare for each installed model. Result at 3 months: non-value time fell from 18% to 9% (a 50% reduction), mean time to repair dropped to 9 h and the cost per failure to 14.000 €.
Planned preventive maintenance (months 4-9). Annual thermography of the 12 cells (8 h of field work plus analysis), insulation measurement every 2 years, annual maintenance of each cell (130 min per cell: 12 cells × 130 min = 26 h/year of preventive maintenance) and 2 failure drills per year (8 h each). Result at 9 months: zero failures, one latent fault detected by thermography (overheated contacts, replaced during preventive maintenance) and a simulated repair time of 4 h. The improvement is sustained in the repair time (18 h → 4 h) and in availability (99,98%); the time between failures over the full period was about 41 months per cell.
Consolidation (months 10-24). Quarterly work sampling to validate that the time breakdown does not degrade (with the number of observations calculated by the application for 95% reliability) and cross-referenced with the crew's time records to relate productivity, overtime and availability. Result at 24 months: 2 failures (both in cells outside the initial plan), mean time to repair of 4 h and availability of 99,98% (26×30×24 / (26×30×24 + 4)). The annualized cost stood at 18.000 € of preventive maintenance plus 45.000 € for the 2 failures: 63.000 €/year. Compared with the initial 78.750 €, the net saving was 15.750 €/year (20%). Since the investment in the spare-part kit is not declared in this case, no payback is calculated.
The conclusion that matters: the change was not technological —the cells were the same—, it was organizational and data-driven. Moving from reacting to planning requires knowing how long each task takes and how much each failure costs; with those two numbers, the plan stops being a promise and becomes an approvable decision.
What You Gain and What You Decide with These Data
With reliable times and work sampling, you stop deciding in the dark:
- You commit to deadlines with grounds: you know that an HV circuit breaker outage is 11 h of planned work, not "a day or so", and that a 630 kVA transformer requires more than 26 h including degassing.
- You budget maintenance for what it actually costs: the 22.500 € of a failure versus 14.000 € after standardizing, and the full annual cost, not the count of parts.
- You approve (or reject) the preventive plan with figures: in the case above, 63.000 €/year versus 78.750 €/year, with 15.750 €/year (20%) savings and availability of 99,98%.
- You know where to cut without cutting safety: the only eliminable part was in the 18% of non-value time, never in the five golden rules nor in the physical times of the equipment.
Put Numbers to Your Maintenance
If you want to know what each intervention costs you and plan with guarantees, start by measuring: Cronometras for the time of each task and WorkSamp for that of the whole working day. And if you need to match your crew's hours with production, Induly gives you industrial time tracking from the mobile app or the plant kiosk, with export to Excel, CSV and PDF.
Would you like support for the first study? At ProdCont we help manufacturing companies make decisions with time data.
Don't want to do it yourself? We do it for you from €800
If you prefer to outsource it, Cronometras delivers a complete time and motion study from a single video: elemental breakdown, OIT/TAL fatigue allowances, standard time with tolerances, and a report in PDF + Excel + JSON ready to present to management.