In contemporary process engineering, precision in work measurement is the boundary between a profitable plant and one saturated with hidden inefficiencies. The String Diagram, often underestimated in favor of more complex simulation tools, remains the fundamental pillar for the topological analysis of movement.
This technical article breaks down the rigorous application of this tool under ILO standards, its critical integration with predetermined time systems (MTM/MOST), and its evolution toward Digital Twins on the 2025 industrial horizon.
The String Diagram in the Context of Work Measurement
Technical definition according to the ILO and current relevance
According to the "Introduction to the Study of Work" by the International Labour Organization (ILO), the string diagram is defined as a scale model (plan or layout) in which the path of workers, materials, or equipment is traced and measured with a string during a given sequence of events.
Unlike simple observation, this tool quantifies traffic density and total distance traveled. In an environment where Lean Manufacturing seeks the systematic elimination of waste, the string diagram makes spatial waste objective.
Structural differences from the Flow Process Chart
While the Flow Process Chart (OTIDA) focuses on the chronological sequence and the nature of the activity (Operation, Transport, Inspection, Delay, Storage), it lacks the spatial dimension. A flow process chart may indicate a "Transport," but it will not reveal that this transport involves crossing a forklift traffic area three times, creating risks and waiting times. The string diagram complements the flow process chart by providing the topography of the process, which is essential for an effective layout redesign.
The impact of unnecessary transport (Muda) on technical productivity
Transport is one of the seven forms of Muda (waste). From the time engineering perspective, operator movement is non-value-added time (NVA). Reducing 10 meters in a repetitive high-frequency cycle (e.g. 500 cycles/shift) is not a marginal improvement; it is the release of man-hours per year. Analysis tools such as Cronometras, which allow the breakdown of elements through video analysis, make it easier to identify this idle time, but it is the string diagram that diagnoses the spatial root cause.
Integration with Predetermined Time Systems (PTS) and OEE
The validity of a time standard depends on the accuracy of the input data. The string diagram acts as a prior audit for the application of PTS.
Validating distances for sequence parameters in MOST
In the MOST (Maynard Operation Sequence Technique) method, the "General Move" model uses the distance parameter ($A$) to index the time.
- Without an accurate string diagram, the analyst estimates the distance "by eye," introducing variability.
- A scale diagram makes it possible to determine whether the movement corresponds to an index (within reach) or scales up to an $A_{10} (3-4 steps), drastically affecting the final TMU (Time Measurement Unit).
Eliminating 'Walk' (W) movements in MTM-2 and MTM-UAS analysis
In MTM (Methods-Time Measurement) systems, specifically MTM-2 and UAS, the code 'W' (Walk) is assigned per meter or step. The string diagram enables reverse engineering: before calculating the standard time, the workstation is redesigned so that the code 'W' tends toward zero. If the operator has to move around to look for raw material, the process is not optimized.
Correlation between route optimization and OEE Performance
OEE (Overall Equipment Effectiveness) is directly affected by movement inefficiency through the Performance factor. An operator who spends 15% of the cycle walking reduces the theoretical production speed. To monitor how these physical changes impact availability and overall efficiency in real time, it is advisable to integrate production control platforms such as Induly, which make it possible to correlate the reduction in physical distances with the immediate increase in the plant performance KPI.
Rigorous Execution Methodology on the Shop Floor
For the diagram to have engineering validity, it must follow a strict protocol:
Layout survey and precision scales (1:50 / 1:100)
The floor plan must be exact. A 5% scale error invalidates the subsequent time study. The following are recommended:
- Scale 1:50 for individual workstations or manufacturing cells.
- Scale 1:100 for flow analysis in complete buildings. Not only machinery must be included, but also columns, fire extinguishers, temporary racks, and actual traffic areas (not just those painted on the floor).
Weighting by frequency and calculation of the Origin-Destination Matrix
The visual tracing is qualitative; engineering requires quantitative data. An Origin-Destination Matrix must be constructed where: $$ D_{total} = \sum_{i=1}^{n} (d_i \times f_i) $$ Where is the distance of the segment and is the frequency per shift. A short route performed 1000 times is more critical than a long route performed once. To obtain these frequencies scientifically without spending the whole day on the shop floor, the use of Work Sampling tools such as WorkSamp makes it possible to collect statistically significant data on the frequency of movements.
Identifying spatial bottlenecks and crossing points
The diagram will visually reveal where the most strings accumulate. These "hot spots" indicate:
- Collision risk (Safety).
- Flow congestion (Logistics bottleneck).
- Optimal location for shared tools or quality controls.
Technological Evolution: From Physical String to Digital Twin
Industry 4.0 turns cotton thread into data vectors.
Digital Spaghetti Diagrams through CAD/BIM integration
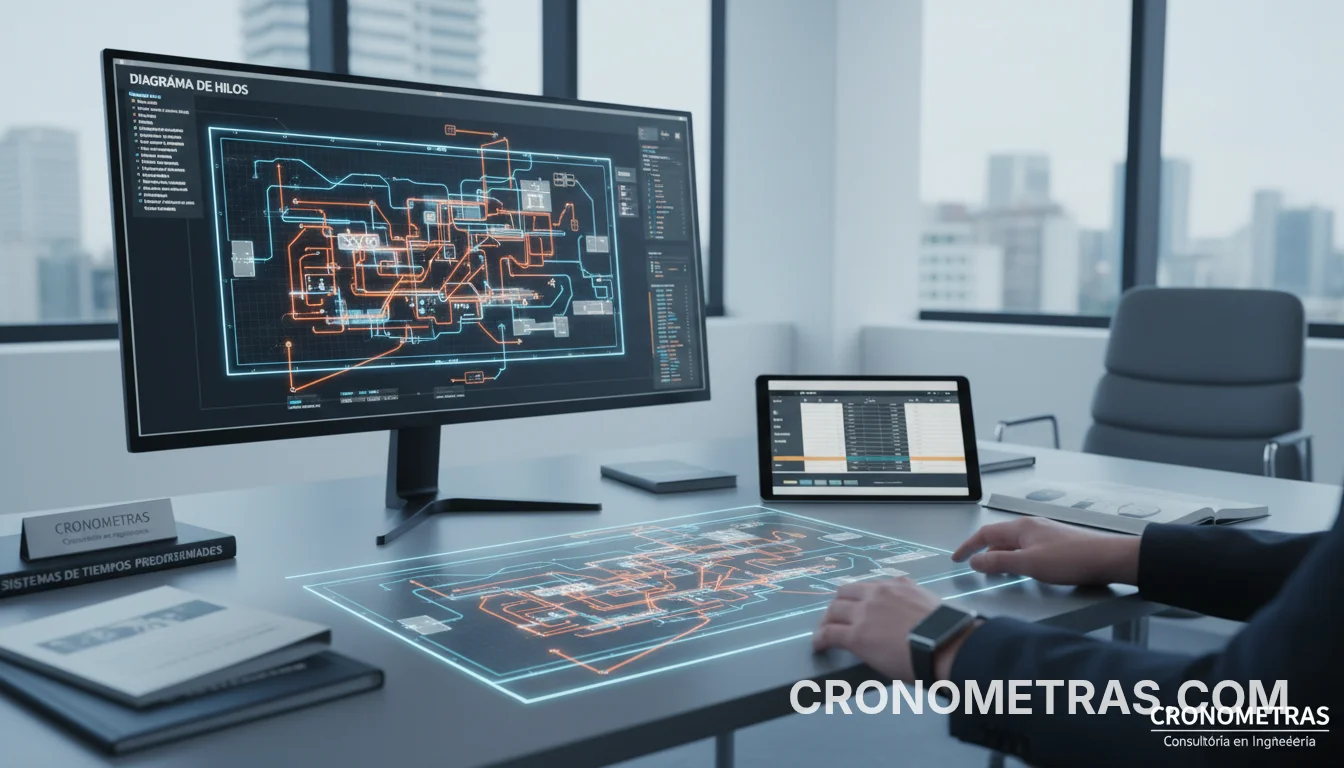
The use of CAD software makes it possible to generate the diagram ("Spaghetti Diagram") on the digital layout. This facilitates simulation: "What happens to the total distance if I move the machining center 2 meters to the left?". The recalculation is instantaneous, allowing layouts to be iterated before moving a single machine.
Using RTLS and UWB systems for real-time Heatmap generation
UWB (Ultra Wide Band) technology and RTLS (Real-Time Location Systems) make it possible to place tags on operators or forklifts. The system traces the string diagram in real time, generating historical heatmaps (Heatmaps). This eliminates observer bias ("Hawthorne Effect") and provides massive data for process variability analysis.
Motion Capture (MoCap) and AI to distinguish value added vs. movement
Advanced artificial vision systems can now automatically distinguish between an operator who is "assembling" and one who is "walking." This automatic segmentation directly feeds the methods study, reducing the engineer's analysis time.
2025 Regulatory Framework: Ergonomics and Data
ISO 11228-1/2: The diagram as evidence in ergonomic assessments
The ISO 11228 standards (Manual handling of loads) penalize the transport of loads over long distances. The string diagram serves as documentary evidence in occupational health and safety (PRL) audits, demonstrating that the company has taken technical measures to minimize accumulated fatigue from movement.
Digital monitoring and GDPR compliance in Spanish industry
The digitalization of the string diagram (people tracking) potentially conflicts with the GDPR and the Data Protection Act. It is crucial to anonymize the data collected through RTLS or sampling tools such as WorkSamp, focusing on the "Role" and not the "Person," to ensure regulatory compliance while optimizing the process.
Energy efficiency (ISO 50001) applied to intralogistics
In fleets of electric forklifts and AGVs, distance is energy. Route optimization validated by string diagrams contributes directly to the objectives of ISO 50001, reducing kWh consumption per unit produced and extending battery life.
Conclusions: The String Diagram as a Process Audit
The string diagram is not a drawing exercise; it is an audit of spatial efficiency.
Reduction of Standard Time and justification of ROI in Layout changes
Implementing improvements based on this diagram usually results in reductions in Standard Time ($T_s$) of between 10% and 20% in logistics and assembly operations. This figure is the basis for calculating the ROI of any plant reengineering project.
Eliminating logistics waste before direct time study
The golden rule of Cronometras is clear: A method that has not been optimized must not be timed. The string diagram is the necessary filter that ensures the final standard time reflects an efficient process, free of transport muda, and ready for high productivity.
Don't want to do it yourself? We do it for you from €800
If you prefer to outsource it, Cronometras delivers a complete time and motion study from a single video: elemental breakdown, OIT/TAL fatigue allowances, standard time with tolerances, and a report in PDF + Excel + JSON ready to present to management.