In contemporary methods engineering, measuring multi-resource work demands going beyond classical time study. For plant managers and industrial engineers, mastering the multiple activity chart is essential to make interference times visible, eradicate forced idleness, and carry out a mathematical crew balancing. Discover how integrating MTM and MOST systems maximizes OEE and prepares plants for the challenges of the 37,5-hour working week.
Evolution of the Multiple Activity Chart in Methods Engineering
The OIT Fundamentals versus Industry 5.0
The guiding principle laid down by the OIT (International Labour Organization) in its classic "Introduction to the Study of Work" remains unchanged: the imperative need to make interference times and forced idleness visible when several resources (people and/or machines) interact in a common work cycle. However, in the Industry 5.0 paradigm, the variability of the human factor in the face of collaborative automation requires a far more granular measurement approach, where the operator-machine synergy demands the elimination of every millisecond of passive waiting.
From the Paper Worksheet to Digital Twins
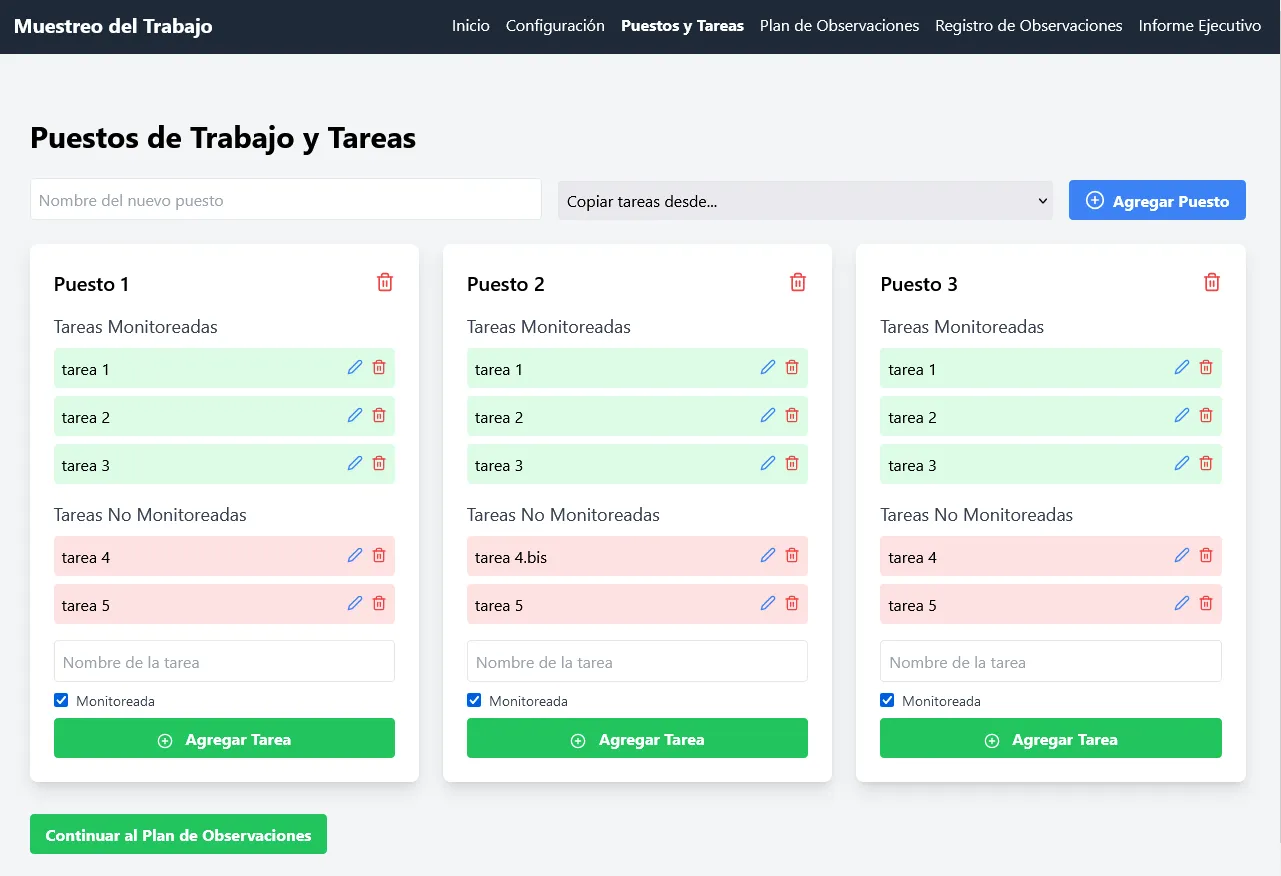
Shop-floor analysis has moved beyond the traditional paper worksheet and the sexagesimal stopwatch. Today, high-performance production lines integrate the multiple activity chart into simulation platforms and digital twins. Using tools such as Cronometras, time analysts can conduct studies with Multi Crono and structured video recordings, leaving rough estimates behind to work with irrefutable data, enabling a precise and reproducible methods audit.
Visibility of Interference Times and Concurrent Waits
The "inefficiency" in multi-resource work cells rarely lies in the speed at which a worker performs individual motions. The true productivity sink is the poor architecture of concurrent waits. Making it mathematically visible when one resource is blocked waiting for another is the essential first step for converting hidden idle time into available installed capacity.
The Technical Challenge in Operator Coordination
Saturation Analysis in Complex Work Cells
Contemporary industrial teamwork faces a critical saturation challenge. Current plant analyses show that, without mathematical crew balancing, losses from desynchronization (crossed waiting times) consume between 18% and 32% of the total cycle time in complex assembly cells, preventive maintenance, and large-tonnage logistics operations.
Identification of the Bottleneck Operator (Saturation at 95-98%)
In a crew of 3 to 5 operators without an optimized multiple activity chart, a serious imbalance is statistically common. The "Bottleneck" operator usually works at a critical saturation level of 95-98%, bearing the greatest physical and cognitive load, while adjacent auxiliary operators show precarious saturation levels of 45-60%. This disparity not only burdens Lead Time but also generates localized fatigue.
Losses from Desynchronization in SMED and Setup Processes
In format changes (Setups) coordinated using SMED techniques, the lack of visualized synchronization produces an average of 24% idle time per operator due to non-overlapped dependent sequences. To quickly identify these macro-inefficiencies statistically before undertaking detailed reengineering, plant managers turn to applications such as WorkSamp, which makes it possible to carry out Work Sampling studies (Work Sampling) and identify the real activity-versus-idleness ratios in the plant.
Predetermined Time Systems for Crew Balancing
Operator coordination is no longer addressed through global estimates or traditional time studies subject to the "Rating Factor" (Bedaux or BSI scale), but through methods micro-engineering using predetermined time systems.
Micro-Engineering with MTM-UAS: Eliminating Impossible Simultaneities
The MTM-UAS system (Universal Analysing System) is the technical standard par excellence for batch production. Integrated into a multiple activity chart, MTM makes it possible to foresee and eliminate "impossible simultanities"; for example, avoiding the design of a method in which two operators have to assemble parts simultaneously in a confined physical space or using the same tooling concurrently.
Converting Variability into Constant TMU Units
By replacing measured times — subject to the variability of human performance — with the standardized precision of Time Measurement Units ($1 \text{ TMU} = 0,036 \text{ seconds}$), the crew architecture is guaranteed to be theoretically perfect before its physical implementation. This eradicates the subjective bias inherent in performance rating.
Maxi MOST for Team Sequences in Heavy Assembly and Aerospace
For large-scale processes (aerospace, capital goods, or shipyards), the Maxi MOST system (Maynard Operation Sequence Technique) makes balancing extraordinarily easier. It makes it possible to model the use of overhead cranes or shared heavy tools, creating "team sequences." In this context, parametric variables such as the action distance ($A$) and body motion ($B$) of an operator algorithmically determine the exact start moment of Operator 2's sequence.
Direct Impact of the Crew Chart on OEE
Optimization of the Performance Factor (Ideal Cycle Time)
Any redesign of a multi-resource process directly impacts the denominator of the Performance equation within OEE ($Performance = \frac{Actual Production \times Ideal Cycle Time}{Operating Time}$). By rebalancing the workload and reducing the cycle time of the bottleneck resource, the "Ideal Cycle Time" decreases, proportionally raising the Performance factor.
Transforming Idle Time into Installed Capacity
Once the optimized chart is applied, the overlapping dead times are grouped together. This recovered time can be capitalized in two ways: by taking on new micro-tasks (such as self-quality control or preparation of the next batch) or by reducing the net Lead Time of the assembly, which translates into a direct increase in production capacity (pieces/hour).
Suppressing Bias in the Rating Factor (Bedaux/BSI Scale)
Using a chart based on MTM/MOST standards protects time standards from union disputes. As these are international and auditable methodologies, the classic conflict over whether the rated pace (100 BSI or 60 Bedaux) has been estimated too high or too low by the analyst is eliminated.
2025 Regulatory Framework: Work Densification without Occupational Risks
The legislative scenario demands that the methods engineering service seek not only profitability but full regulatory and ergonomic compliance.
Output Strategies in the Face of the Reduction to 37,5 Hours
The imminent consolidation of the 37,5-hour working week poses for operations directors the challenge of maintaining identical Output with 6,25% less available time. Condensing operations and removing the slack from the multiple activity chart is not a continuous-improvement option; it is a matter of strict survival for manufacturing margins.
Ergonomics and Postural Load Distribution (Standard UNE-EN 1005)
Audits in 2025 penalize musculoskeletal disorders harshly. Task redistribution within a crew must strictly respect the load-lifting limits and repetitiveness of standard UNE-EN 1005. The "Synchronization Engineering" methodology sets maximum sustained saturation at a safe ergonomic limit of 85%.
Strict Recalculation of Allowances for Fatigue and Contingencies (OIT)
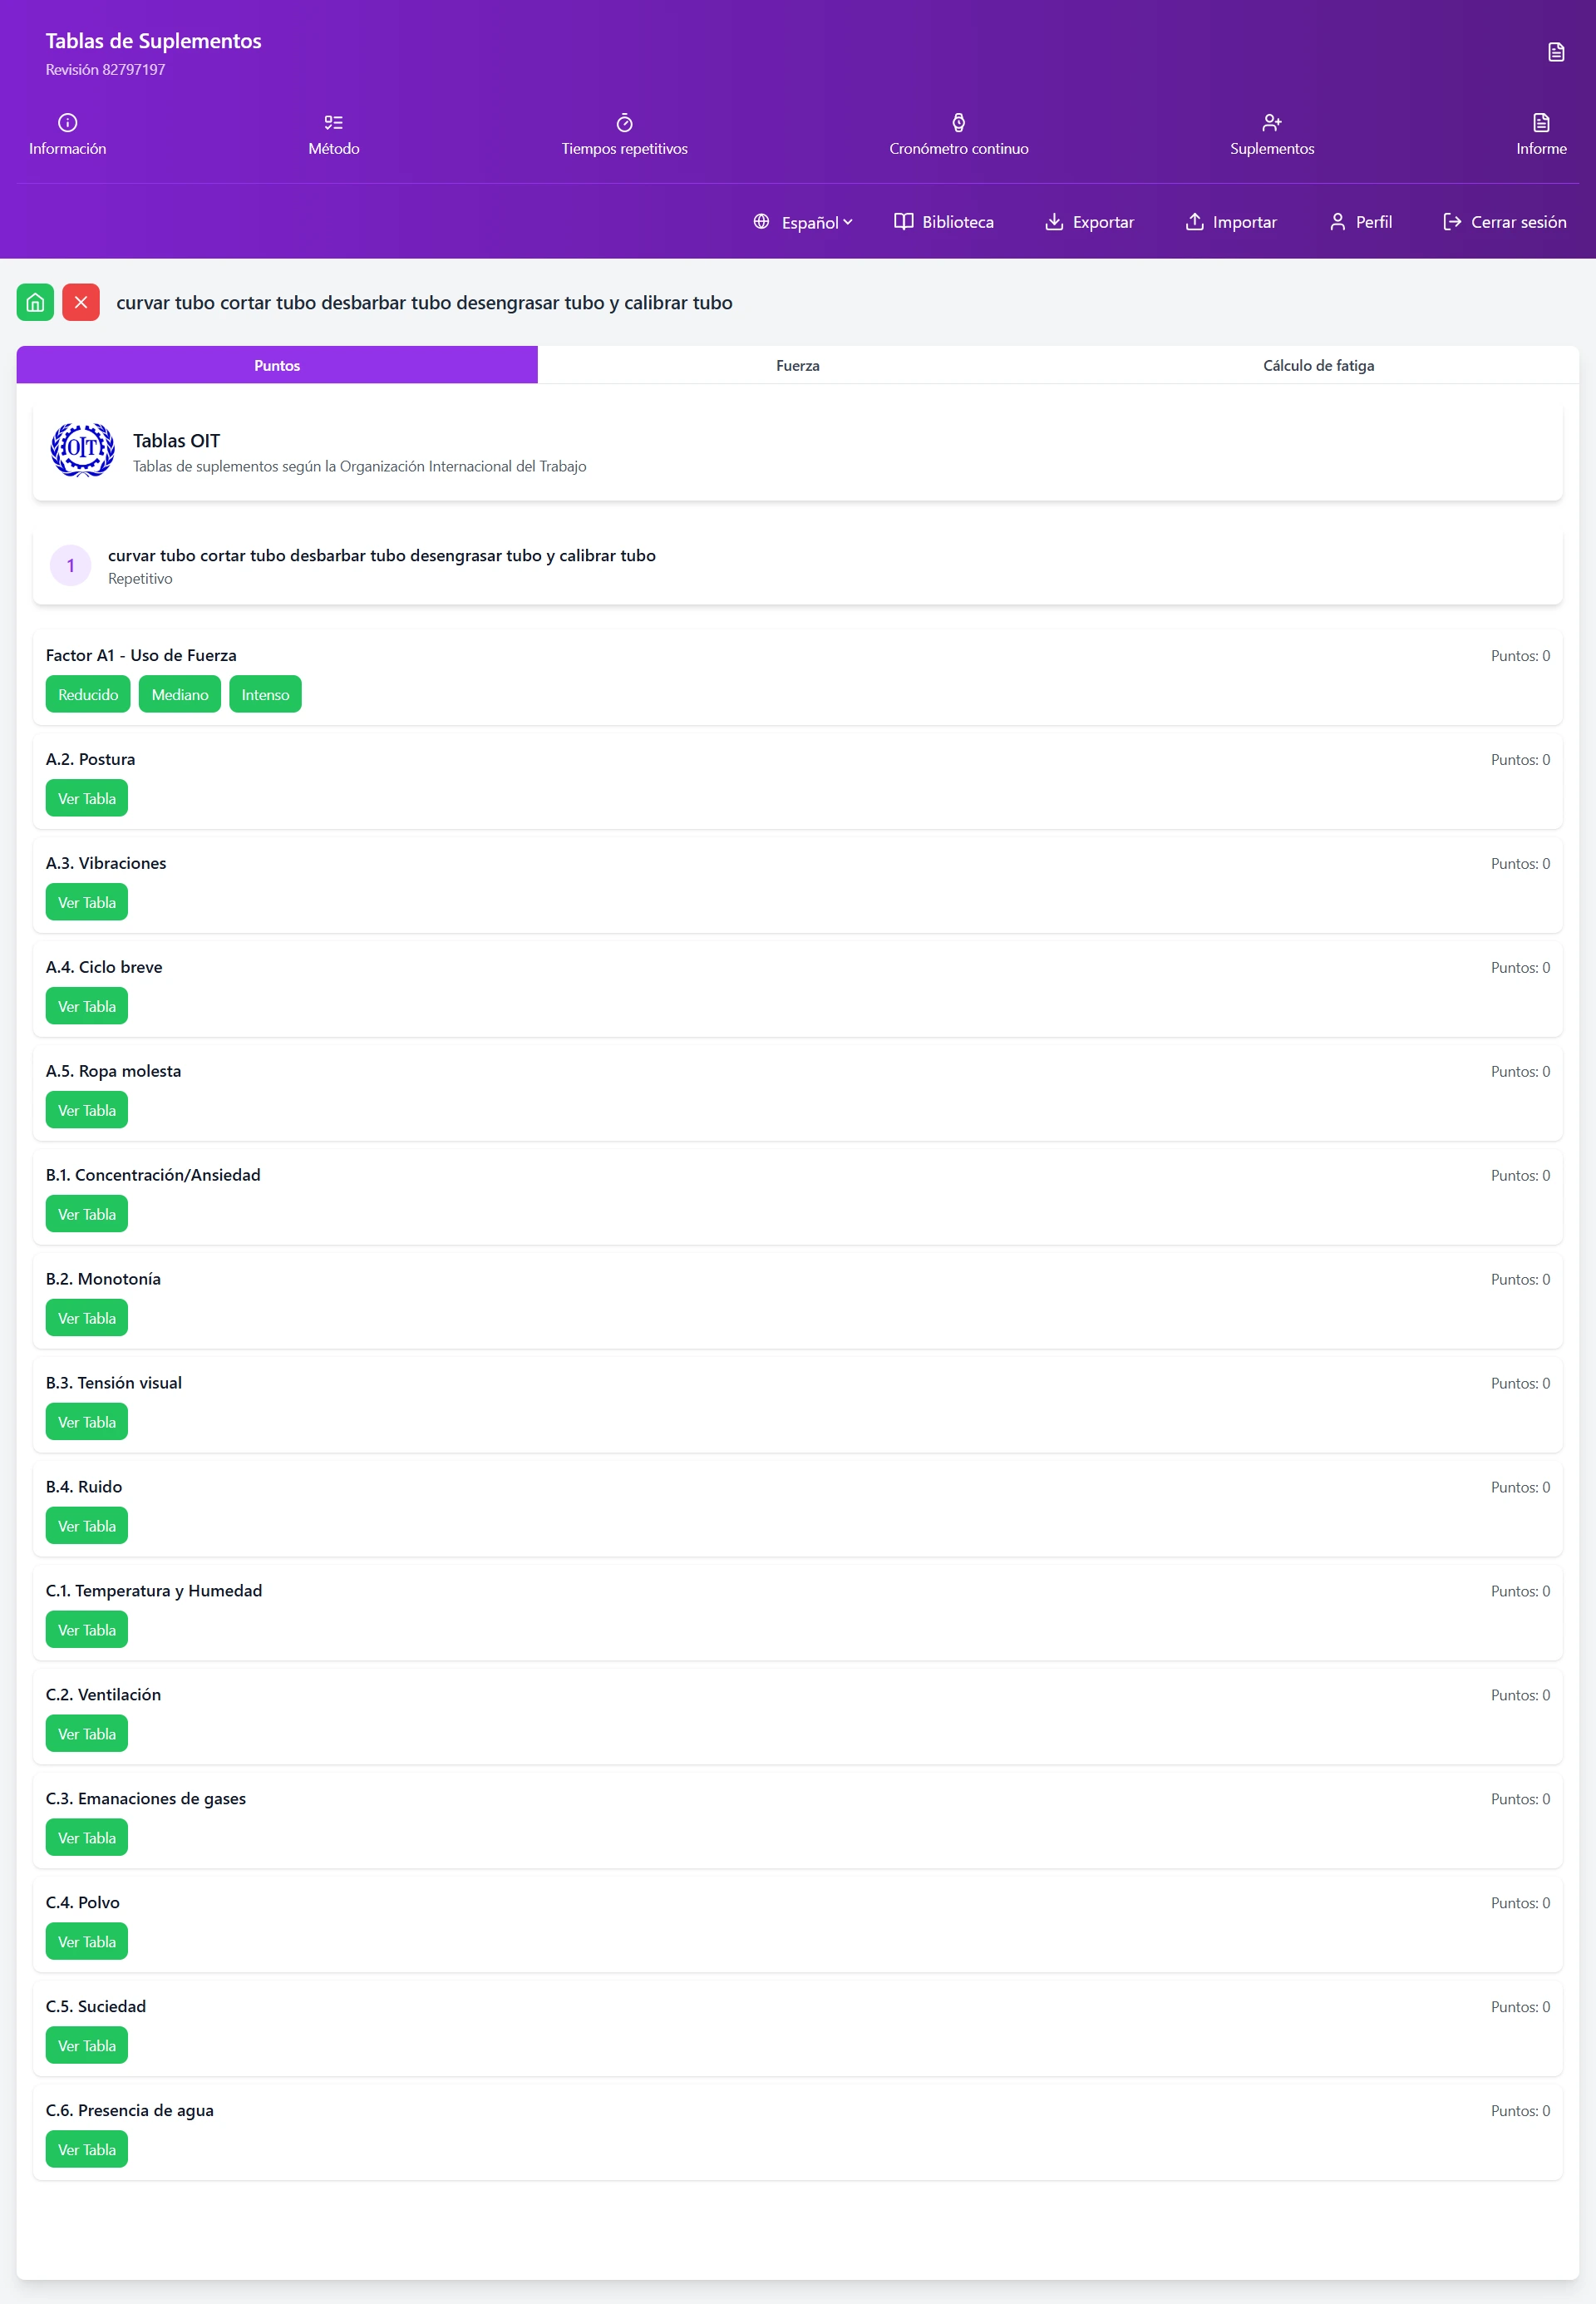
Any modification in the crew's work cycle requires a recalibration of the rest allowances. As work density increases (greater saturation per minute), the variable fatigue allowances (mental effort, posture, thermal conditions) must be adjusted with arithmetic precision according to the OIT tables to ensure technical validation before health and safety committees.
Synchronization Engineering: Auditing and Continuous Improvement
OEE Audits for Multi-Resource Work
Specialized consulting no longer simply sells "time studies," but advanced OEE audits for multi-resource work. To sustain these improvements over time, once the production line has been calibrated, it is imperative to connect the technical standard with the plant's production reality. MES platforms such as Induly are vital in this phase, offering real-time production control and industrial time recording to measure daily profitability and prevent the degradation of the implemented standard.
Comparative Methodology: The Unbalanced Chart vs. the Optimized Cell
The technical approach for any plant manager lies in the analysis of the "Before" and the "After." In recent implementations evaluated by Cronometras, moving from an unbalanced chart (with high visible dead times) to a cell optimized through balancing algorithms makes it possible to reduce the crew's cycle time by between 15% and 22%.
ROI Calculation: Lead Time Reduction and Increase in Pieces/Hour
The Return on Investment (ROI) in synchronization engineering materializes in the short term. Optimizing the multiple activity chart usually pays back the consulting project within the first three months, achieving not only a verifiable increase in pieces/hour but also guaranteeing an ethically balanced, ergonomic workload, shielded against the demanding industrial regulatory framework of 2025.
Don't want to do it yourself? We do it for you from €800
If you prefer to outsource it, Cronometras delivers a complete time and motion study from a single video: elemental breakdown, OIT/TAL fatigue allowances, standard time with tolerances, and a report in PDF + Excel + JSON ready to present to management.